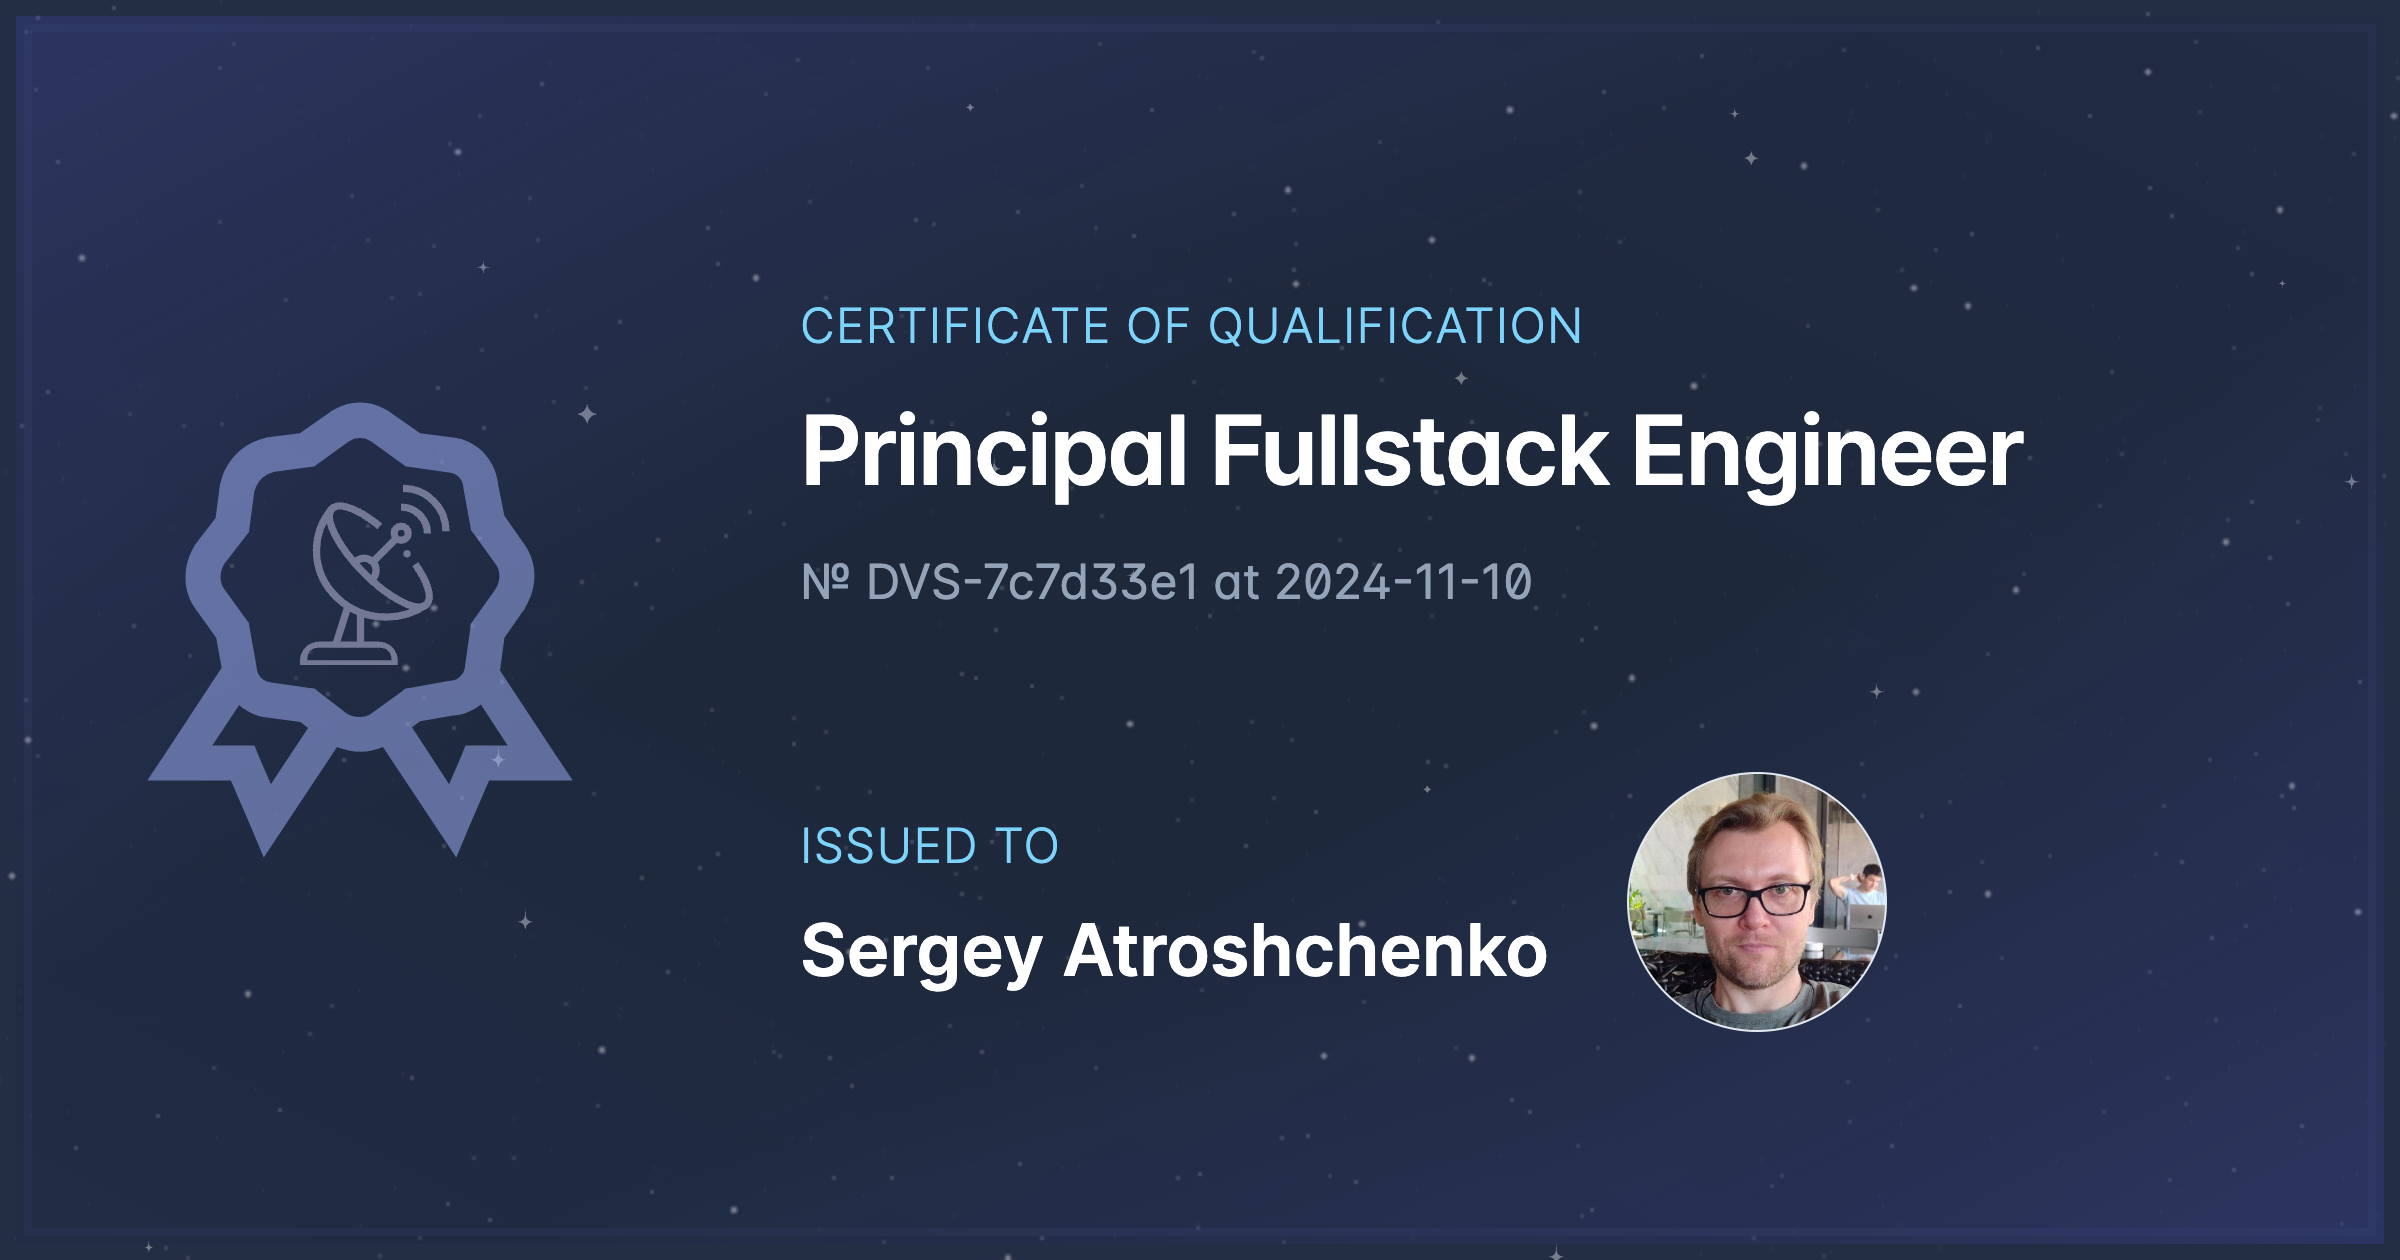
Certificate details
A DevScanr certificate confirms the authenticity of a specialization, skills and (optionally) a seniority of its respective holder. It confirms that these key statements are indeed correct and can be trusted. Besides that, the certificate page provides an extended overview of competencies, top tech skills (in dynamics and in comparison), along with other valuable insights.
The Certification program page includes the motivation, the limitations and the general description of how-it-works. The only part worth repeating here is that the qualification process starts with an automatic analysis of an open data by dedicated ML algorithms, and ends with human approval by a subject-matter expert.
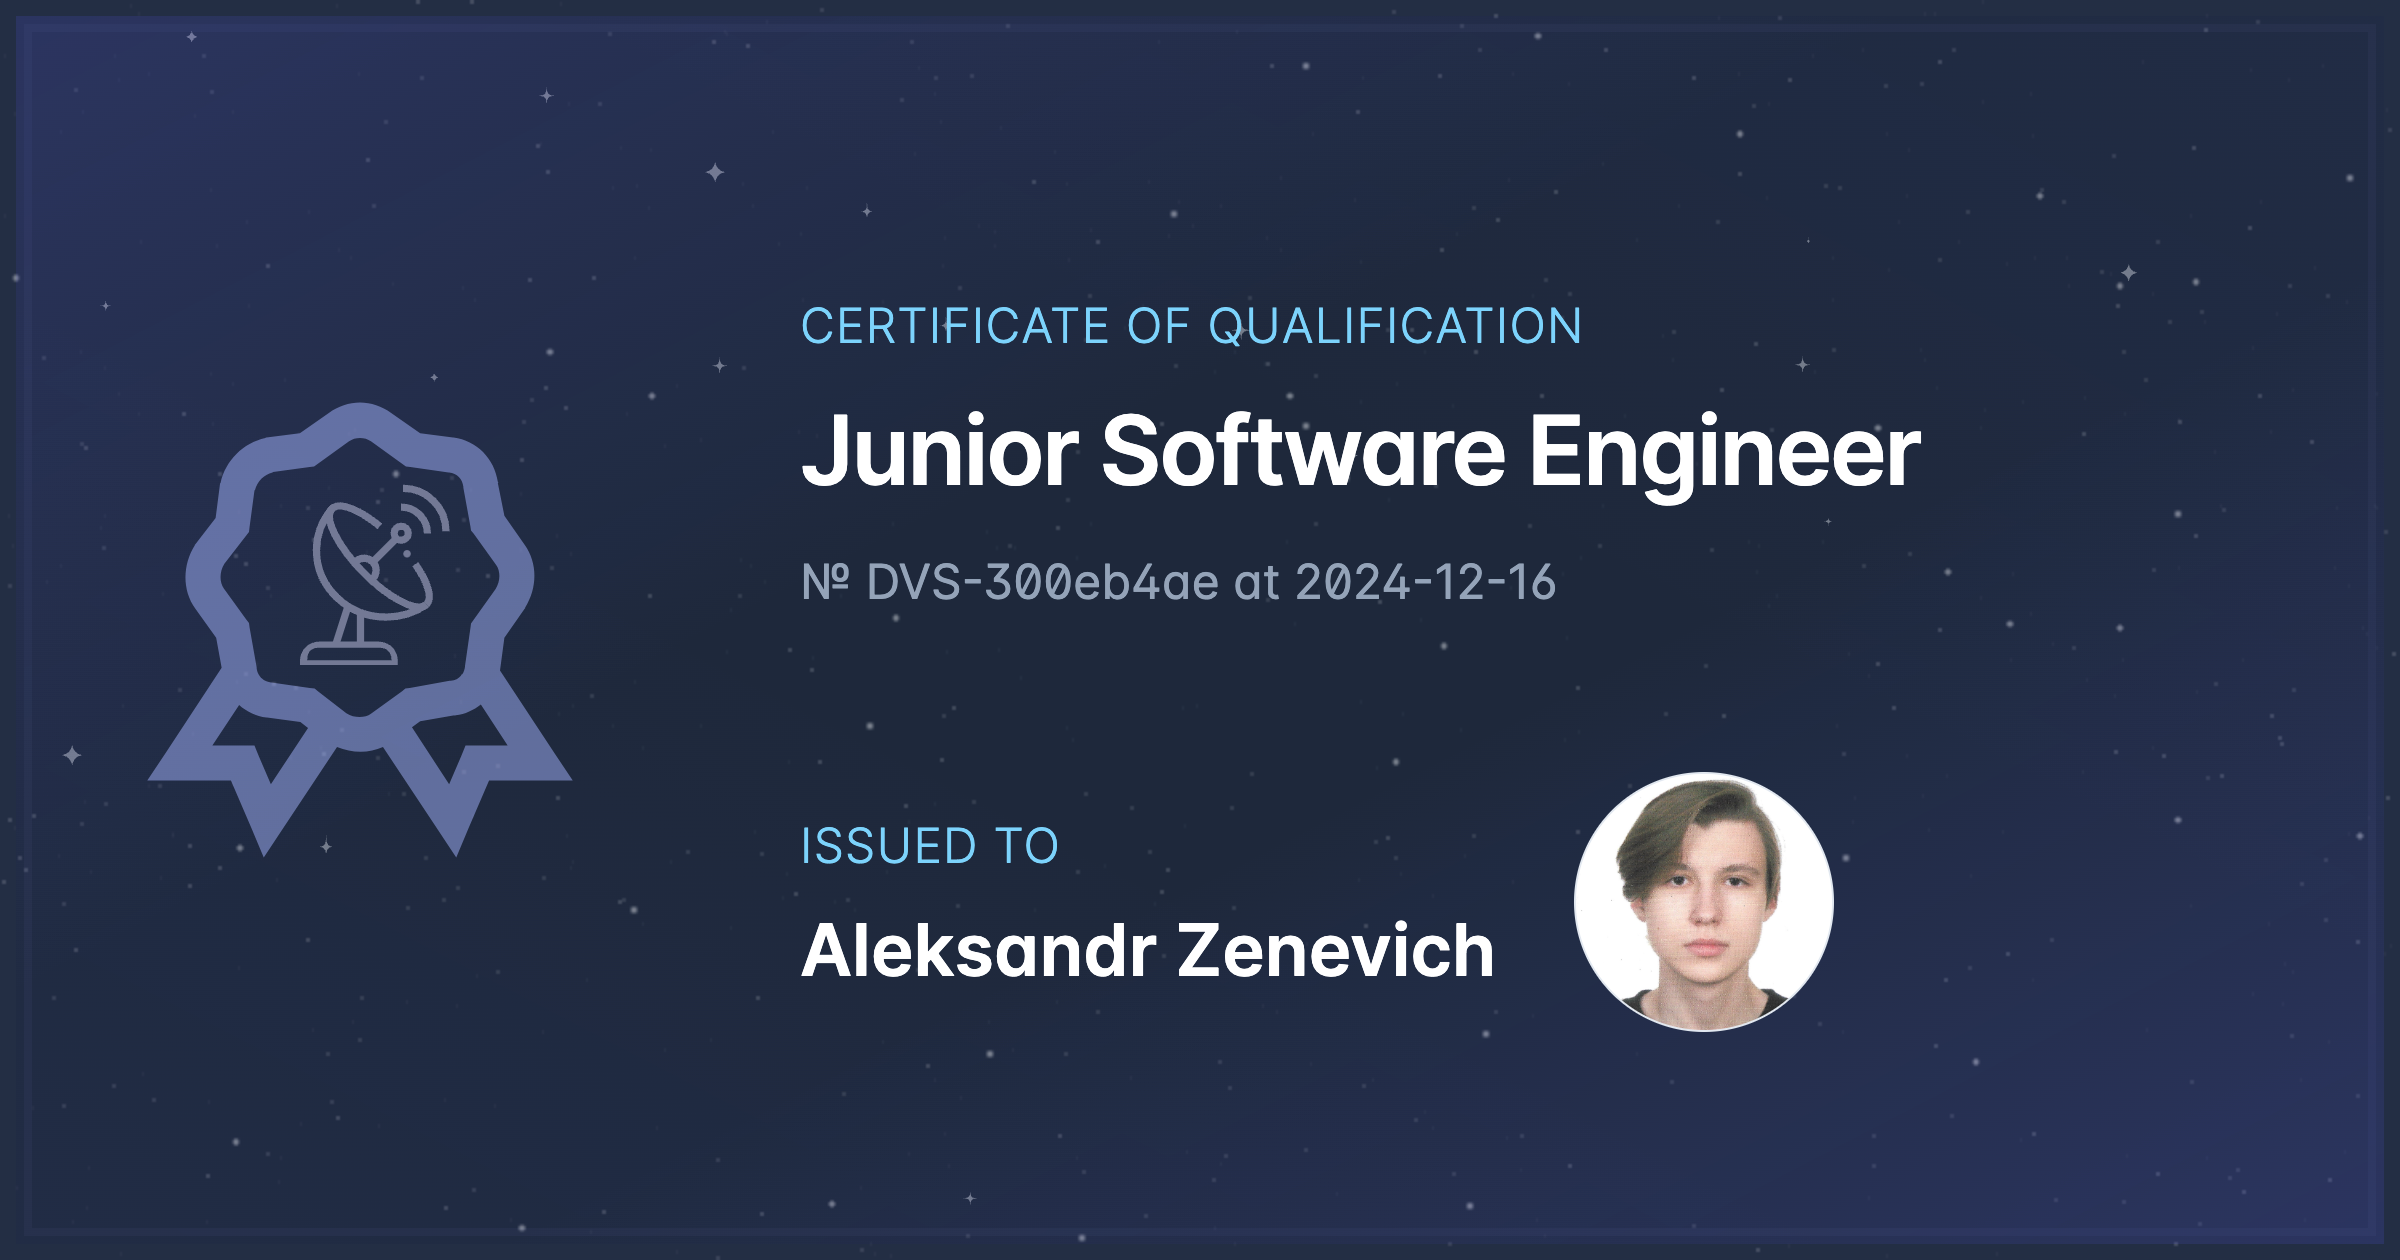
Click on the images to explore real issued certificates.
Each certificate reflects unique experience and competence, history of tech applications, professional interests. We intend this to be interesting and revealing to both a holder and a recruiter. The holder can learn how his/her profile looks like to an outsider and what impression it creates. The recruiter can get or reinforce confidence in developer’s aptitude.
Such a document establishes a strong foundation of trust for the following reasons:
- It is based on time-stamped data that can’t be altered afterwards (while preserving the timestamps).
- It is based on real-world user activity that was never intended to present someone in the best light.
- It relies on unbiased fourth party confirmations (earned stars, followers, etc.).
- It has passed extra anti-fraud checks.
DevScanr certificate is issued by a neutral third party. It is based on objective, career-agnostic information and relies on community assessment. It confirms hard skills in the best way possible. One thing we can’t guarantee is that a certificate holder is a “good person” 😇
In addition to standard fields such as a person’s name, title, cert-ID, and issue date, DevScanr certificates include unique information about their holders. Namely, the following blocks are intended to elaborate the qualification result.
Verified competencies
Roles and domains extracted and confirmed by DevScanr
This section lists individual roles and domains extracted and confirmed by DevScanr. For example, a frontend engineer might be recognized as an engineer (role) with frontend, backend, and design (domains) competencies. These competencies are indicated by percentages to reflect their relative significance within the overall skill set. Like every generalization, it’s not intended to be an exhaustive list. One surely might have more talents, like people management for example, which we can’t infer from the GitHub data.
Engineers with diverse lists of roles and domains are, most likely, generalists. While those with fewer, more focused areas, ought to be specialists in corresponding fields. It’s very important to know if someone is a specialist or a generalist before hiring them, and DevScanr shares this rare information.
Top tech skills dynamics
Top tech skills of a talent
This heatmap chart reflects how top tech skills of a talent changed (or persisted) over time. The timeline goes left to right, and each unit represents a year quarter. Saturated purple indicates the highest level of activity, while desaturated indicates the lowest. Blank space represents periods with no detected activity.
DevScanr operates on public data and it’s quite probable that an engineer actually kept working with no gaps. We recommend considering the general appearance or disappearance of a certain technology on a track, instead of focusing on each particular quarter.
Top tech skills in comparison
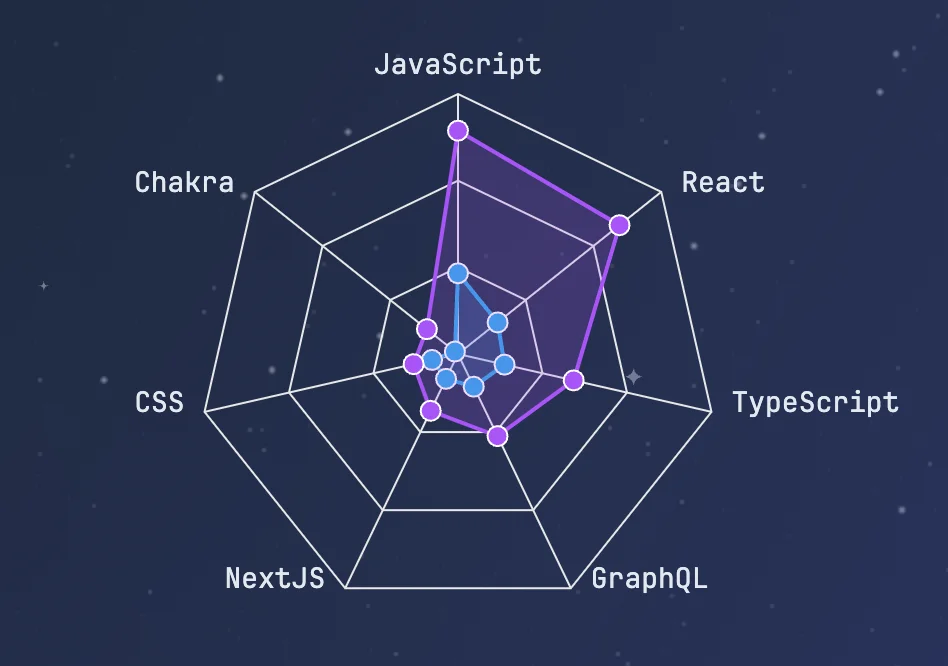
Top tech skills of a person in comparison: to each other and to the industry average
This radar chart reflects how top tech skills of a person look in comparison: to each other and to the industry average. Various performance indicators, such as commit counts and earned stars, contribute to the result. The data is averaged over the same specialization and seniority. The data is normalized and demonstrates proportions (rather the absolute numbers).
A comparison of purple and blue distributions may reveal some interesting patterns of personal preferences. Like the previous heatmap, we recommend drawing a general conclusion from the chart, like whether a particular person prefers legacy or cutting-edge technologies.
'%20x1='50%25'%20y1='0%25'%20x2='50%25'%20y2='100%25'%20id='gggrain-gradient2'%3e%3cstop%20stop-color='%23a257e0ff'%20stop-opacity='1'%20offset='-0%25'/%3e%3cstop%20stop-color='rgba(255,255,255,0)'%20stop-opacity='0'%20offset='100%25'/%3e%3c/linearGradient%3e%3clinearGradient%20gradientTransform='rotate(232,%200.5,%200.5)'%20x1='50%25'%20y1='0%25'%20x2='50%25'%20y2='100%25'%20id='gggrain-gradient3'%3e%3cstop%20stop-color='hsl(0,%200%25,%20100%25)'%20stop-opacity='1'/%3e%3cstop%20stop-color='rgba(255,255,255,0)'%20stop-opacity='0'%20offset='100%25'/%3e%3c/linearGradient%3e%3cfilter%20id='gggrain-filter'%20x='-20%25'%20y='-20%25'%20width='140%25'%20height='140%25'%20filterUnits='objectBoundingBox'%20primitiveUnits='userSpaceOnUse'%20color-interpolation-filters='sRGB'%3e%3cfeTurbulence%20type='fractalNoise'%20baseFrequency='0.89'%20numOctaves='2'%20seed='2'%20stitchTiles='stitch'%20x='0%25'%20y='0%25'%20width='100%25'%20height='100%25'%20result='turbulence'/%3e%3cfeColorMatrix%20type='saturate'%20values='0'%20x='0%25'%20y='0%25'%20width='100%25'%20height='100%25'%20in='turbulence'%20result='colormatrix'/%3e%3cfeComponentTransfer%20x='0%25'%20y='0%25'%20width='100%25'%20height='100%25'%20in='colormatrix'%20result='componentTransfer'%3e%3cfeFuncR%20type='linear'%20slope='3'/%3e%3cfeFuncG%20type='linear'%20slope='3'/%3e%3cfeFuncB%20type='linear'%20slope='3'/%3e%3c/feComponentTransfer%3e%3cfeColorMatrix%20x='0%25'%20y='0%25'%20width='100%25'%20height='100%25'%20in='componentTransfer'%20result='colormatrix2'%20type='matrix'%20values='1%200%200%200%200%200%201%200%200%200%200%200%201%200%200%200%200%200%2015%20-7'/%3e%3c/filter%3e%3c/defs%3e%3cg%3e%3crect%20width='100%25'%20height='100%25'%20fill='%236e64dc'/%3e%3crect%20width='100%25'%20height='100%25'%20fill='url(%23gggrain-gradient3)'/%3e%3crect%20width='100%25'%20height='100%25'%20fill='url(%23gggrain-gradient2)'/%3e%3crect%20width='100%25'%20height='100%25'%20fill='transparent'%20filter='url(%23gggrain-filter)'%20opacity='1'%20style='mix-blend-mode:%20soft-light'/%3e%3c/g%3e%3c/svg%3e)
 Do I qualify?